


Debugging is an everyday task when it comes to software development. Whether you are working in a team, working alone or contributing to open source projects, we all encounter bugs. These bugs can be caused by syntax errors, wrong algorithm, unterminated loops, etc. To fix these bugs you need to find them first, and this entire process is called Debugging.
In this article you are going to learn how to debug your code directly in Visual Studio Code. We would be using a JavaScript application for our example.
Prerequisites
- Visual Studio Code
- Node.js
- nodemon (optional but will be used in this tutorial)
Visual Studio Code
Visual Studio Code has an inbuilt tool to help you debug your application directly from your editor.
The debugger icon in Visual Studio Code enables you to launch or attach to your running apps and debug with break points, call stacks, and an interactive console.
Let’s get it up and running.
Configurations
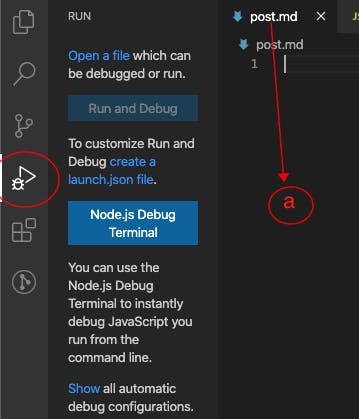
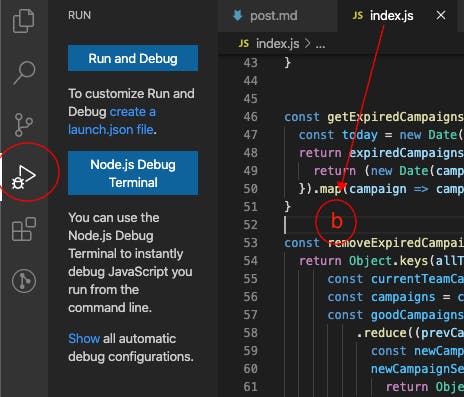
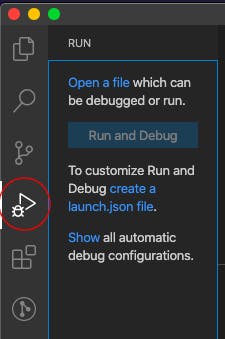
Image a)
If the opened tab on your Visual Studio Code is not a debuggable file, click on Open a file and select the file you want to debug.
Image b)
Opened tab is a debuggable file. I will be debugging a JavaScript file that removes campaigns with expired dates from a list of ongoing campaigns. You can find the code here, feel free to clone and follow along.
Method 1 - Run and Debug
Add Break Points and click on Run and Debug as shown in the image above, this will pop up a window for you to select how you want to run your application.
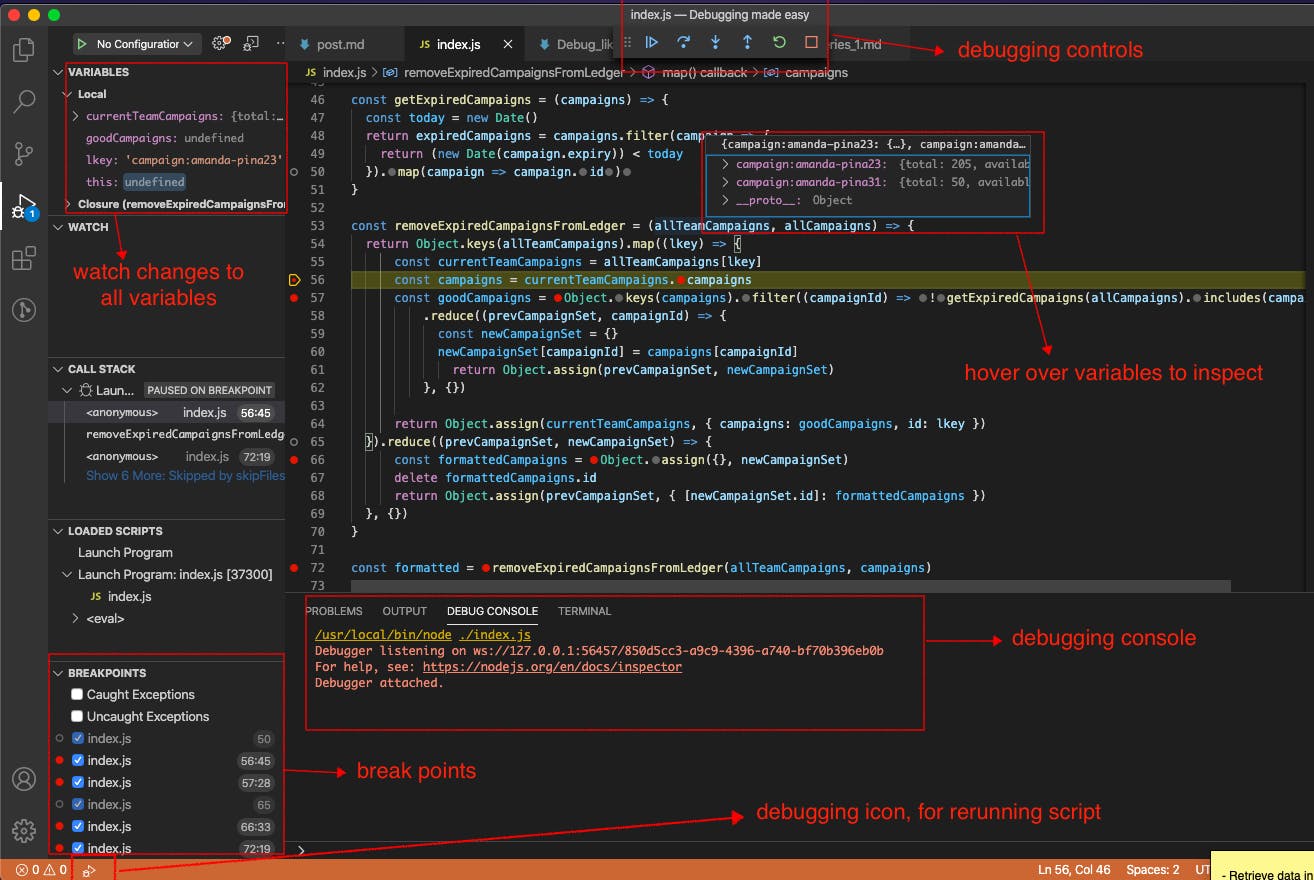
The image below tries to explain how to debug your application. When you run the debugger, you can use break points to explore what is happening in your code. You also have the ability to hover over the variables in your application to see if the hold the intended value.
With this method, you will always need to click on Run and Debug to start debugging.
Method 2 - Configure a launch.json file
Follow along as I show you how to create a launch.json file and configure it to tell Visual Studio Code how to debug your application. The launch.json file is saved in a folder called .vscode. You can create this file yourself or auto-create it with the steps below.
Use any of the steps below
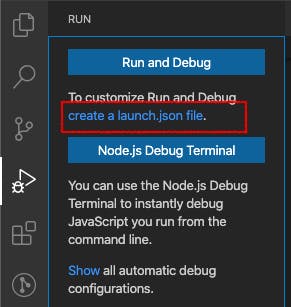
- Click on create a launch.json file
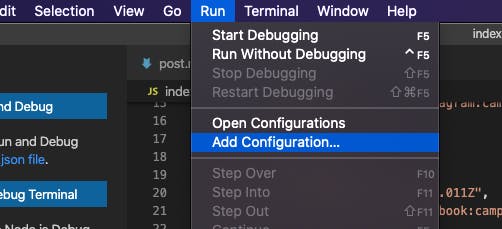
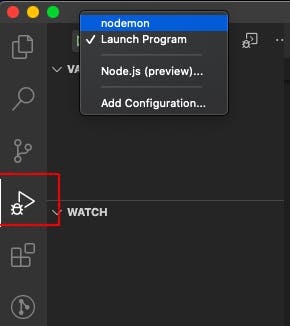
- Select Run from the menu bar and then select Add Configurations
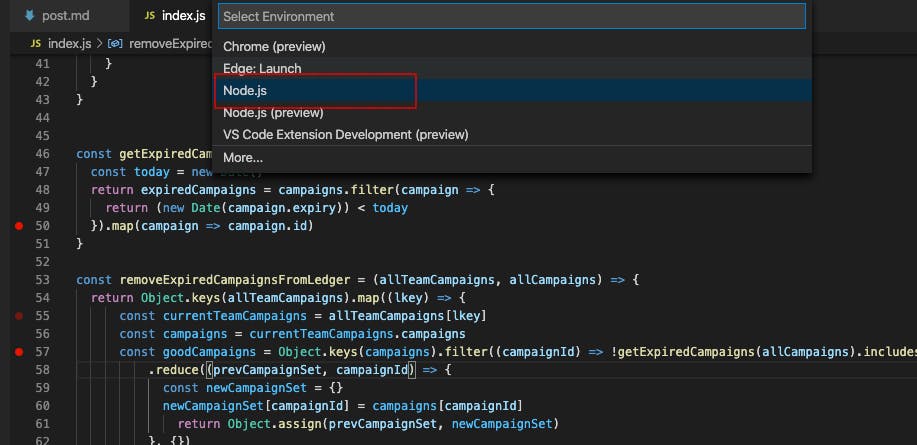
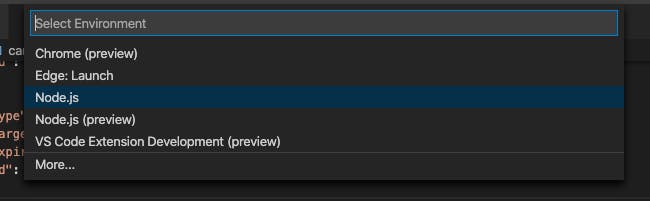
Using any method above, a pop-up window will appear. Because you want to debug your application directly in Visual Studio Code without opening chrome, select Node.js.
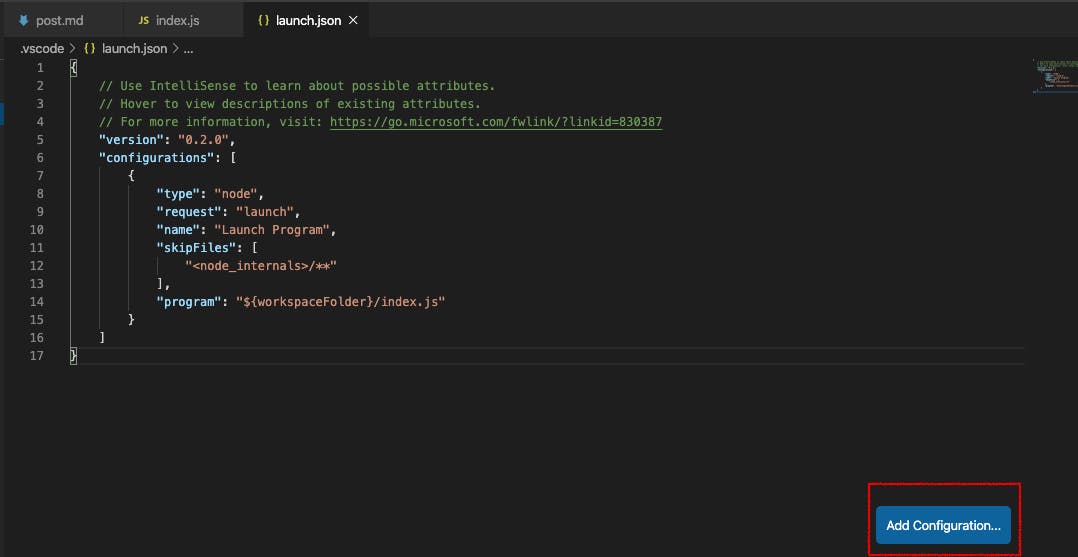
Your launch.json file should look like the the image below. Click on Add Configuration.
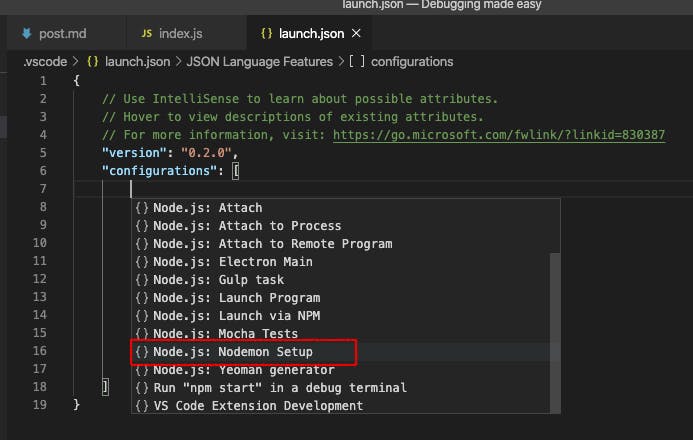
Let’s add a nodemon configuration so we do not have to click on the debug icon whenever we make changes to our file.
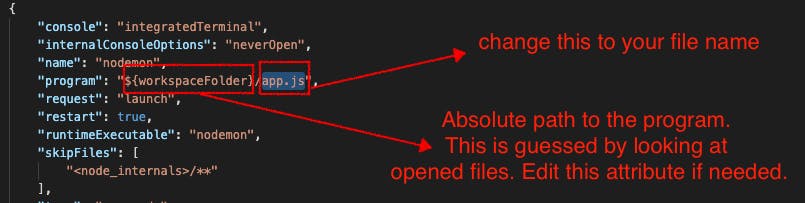
or simply copy the code below into your launch.json file
    {
      "version": "0.2.0",
        "configurations": [
            {
                "console": "integratedTerminal",
                "internalConsoleOptions": "neverOpen",
                "name": "nodemon",
                "program": "${workspaceFolder}/index.js",
                "request": "launch",
                "restart": true,
                "runtimeExecutable": "nodemon",
                "skipFiles": [
                    "<node_internals>/**"
                ],
                "type": "pwa-node"
            },
            {
                "type": "node",
                "request": "launch",
                "name": "Launch Program",
                "skipFiles": [
                    "<node_internals>/**"
                ],
                "program": "${workspaceFolder}/index.js"
            }
        ]
    }
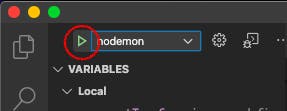
To start the debugger, click on the debugger icon, select how you want to start the debugger. We will select nodemon for this tutorial.
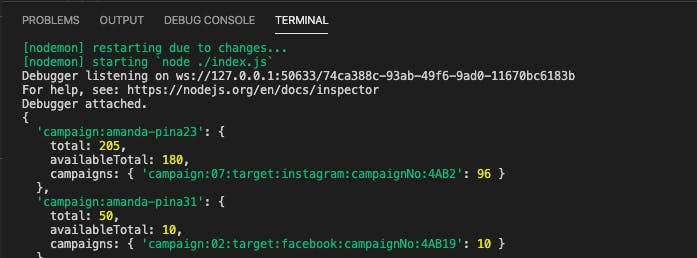
If your terminal looks like the image below, then voilà we have successfully started our debugger. Feel free to add break points, console.log, etc and start debugging. Notice that if you make changes to your code, it auto-restarts the debugger.
Sneak peek
you can see a log of what is happening in your application by simply typing node.index.js or nodemon index.js to enable auto-restart when changes are detected in the file debugged.
Note: This only logs changes to your terminal if you used console.log. You won’t have that full debugging capabilities, like break points, watch, etc.
Conclusion
Your debugger is up and running. In the next series we will explore other ways to debug your code with easy.
I hope you enjoyed this post. You can find me on Twitter, let's connect.